Market Outlook
September 16, 2016
Market Cues
Domestic Indices
Chg (%)
(Pts)
(Close)
Indian markets are likely to open positive taking global cues.
BSE Sensex
0.1
41
28,413
Nifty
0.2
16
8,743
US markets gained on Thursday after weak U.S. retail sales data undermined the
argument that the Federal Reserve will raise interest rates next week.
Mid Cap
(0.3)
(33)
13,092
Small Cap
0.3
34
12,746
European markets closed broadly up on Thursday after the Bank of England kept
rates at 0.25% and announced there would be no change to its £70 billion ($92
Bankex
(0.6)
(134)
22,736
billion) quantitative easing program.
Indian markets rose for a second consecutive session on Thursday, even as the
Global Indices
Chg (%)
(Pts)
(Close)
underlying sentiment remained cautious amid the oil price downturn and concerns
Dow Jones
1.0
178
18,212
over the global central banks' ability to stimulate growth through ultra-easy
Nasdaq
1.5
76
5,250
monetary policies.
FTSE
0.9
57
6,730
News Analysis
Nikkei
(1.3)
(209)
16,405
Transformers and Rectifiers bags `103cr order from PGCIL
Hang Seng
0.6
145
23,336
Detailed analysis on Pg2
Shanghai Com
(0.7)
(21)
3,003
Investor’s Ready Reckoner
Key Domestic & Global Indicators
Advances / Declines
BSE
NSE
Stock Watch: Latest investment recommendations on 150+ stocks
Advances
1,488
854
Refer Pg5 onwards
Declines
1,269
741
Unchanged
187
89
Top Picks
CMP
Target
Upside
Company
Sector
Rating
(`)
(`)
(%)
Volumes (` Cr)
Amara Raja Batteries Auto & Auto Ancillary Accumulate
1,039
1,174
13.0
BSE
3,801
HCL Tech
IT
Buy
778
1,000
28.6
NSE
19,232
Bharat Electronics
Capital Goods
Buy
1,219
1,414
16.0
Equitas Holdings
Financials
Buy
178
235
31.8
Navkar Corporation Others
Buy
200
265
32.7
Net Inflows (` Cr)
Net
Mtd
Ytd
More Top Picks on Pg3
FII
(473)
853
41,522
MFs
(185)
(840)
9,269
Key Upcoming Events
Previous
Consensus
Date
Region
Event Description
Reading
Expectations
Top Gainers
Price (`)
Chg (%)
Sep 16
UK
BOE Announces rates
0.25
0.25
Sep 20
US
Housing rates
1,211.0
1,193.0
Tv18Brdcst
44
9.2
Sep 20
US
Building permits
1,144.0
1,170.0
Jubilant
604
8.5
Sep 21
UK
FOMC rate decision
0.5
0.5
Suntv
507
5.5
Sep 22
US
Euro Zone Consumer Confidence
(8.5)
--
Unitech
6
5.4
Sep 22
US
Existing home sales
5.39
5.45
6.(
Dishtv
100
4.9
More Events on Pg4
Top Losers
Price (`)
Chg (%)
Beml
900
(12.3)
Prestige
184
(4.8)
Pcjeweller
494
(4.5)
Ashokley
82
(3.6)
Trent
232
(3.2)
As on September 15, 2016
Market Outlook
September 16, 2016
News Analysis
Transformers and Rectifiers bags `103cr order from PGCIL
Power equipment maker Transformers and Rectifiers announced it has bagged
order worth `103cr from Power Grid Corporation of India Ltd to supply power
transformers.
Transformers and Rectifiers (India) Ltd has been awarded the order for power
transformers up to
220 kV class amounting to
`103cr from Power Grid
Corporation of India Ltd (PGCIL).
With this order, the company's order book as on date stands at `960cr. As per
management the company continuously thrives to deliver quality products and
services and over a period of time has become a leading manufacturer of
transformers in the country.
Economic and Political News
Petrol, diesel consumption hits 5-year high in August
Mines ministry to seek bids for exploration of 20 blocks
Textile package reforms yet to significantly boost jobs, productivity
Corporate News
NMDC, MOIL's `8,400cr buyback offers to open Sept 19
PVR to raise `250cr via NCDs
ONGC inks deal to buy extra 11% stake in Russian Vankor fields
Future Group to add 6 more stores to Central brand
Maruti to launch seven new models in 2017
Market Outlook
September 16, 2016
Top Picks ★★★★★
Large Cap
Market Cap
CMP
Target
Upside
Company
Rationale
(` Cr)
(`)
(`)
(%)
To outpace battery industry growth due to better technological
Amara Raja Batteries
17,753
1,039
1,174
13.0
products leading to market share gains in both the automotive
OEM and replacement segments.
Uptick in defense capex by government when coupled with BELs
Bharat Electronics
29,262
1,219
1,414
16.0
strong market positioning, indicate that good times are ahead
for BEL.
The stock is trading at attractive valuations and is factoring all
HCL Tech
1,09,736
778
1,000
28.6
the bad news.
Back on the growth trend, expect a long term growth of 14% to
Infosys
2,39,192
1,041
1,370
31.6
be a US$20bn in FY2020.
Source: Company, Angel Research
Mid Cap
Market Cap
CMP
Target
Upside
Company
Rationale
(` Cr)
(`)
(`)
(%)
Among the top 4 players in the consumer durables segment.
Bajaj Electricals
2,717
269
306
13.9
Improved profitability backed by turn around in E&P segment.
Strong order book lends earnings visibility.
Favourable outlook for the AC industry to augur well for
Cooling products business which is out pacing the market
Blue Star
4,901
514
578
12.4
growth. EMPPAC division's profitability to improve once
operating environment turns around.
With a focus on the low and medium income (LMI) consumer
Dewan Housing Finance
8,312
285
325
14.1
segment, the company has increased its presence in tier-II & III
cities where the growth opportunity is immense.
Strong loan growth backed by diversified loan portfolio and
Equitas Holdings
5,980
178
235
31.8
adequate CAR. ROE & ROA likely to remain decent as risk of
dilution remains low. Attractive valuations considering growth.
Expectations of above average monsoon augurs well for
Goodyear India
1,420
616
684
11.1
Goodyear India as it derives ~50% of its turnover from farm
tyre segment.
Economic recovery to have favourable impact on advertising &
circulation revenue growth. Further, the acquisition of a radio
Jagran Prakashan
6,259
191
225
17.5
business (Radio City) would also boost the company's revenue
growth.
Speedier execution and speedier sales, strong revenue visibilty
Mahindra Lifespace
1,764
430
522
21.4
in short-to-long run, attractive valuations
Massive capacity expansion along with rail advantage at ICD
Navkar Corporation
2,848
200
265
32.7
as well CFS augurs well for the company
Earnings boost on back of stable material prices and
Radico Khaitan
1,408
106
125
18.1
favourable pricing environment. Valuation discount to peers
provides additional comfort
Strong brands and distribution network would boost growth
Siyaram Silk Mills
1,197
1,277
1,469
15.1
going ahead. Stock currently trades at an inexpensive
valuation.
Market leadership in Hindi news genre and no. 2 viewership
ranking in English news genre, exit from the radio business,
TV Today Network
1,828
307
363
18.4
and anticipated growth in ad spends by corporates to benefit
the stock.
Source: Company, Angel Research
Market Outlook
September 16, 2016
Key Upcoming Events
Global economic events release calendar
Date
Time
Country
Event Description
Unit
Period
Bloomberg Data
Last Reported Estimated
Sep 16, 2016
4:30PM
UK
BOE Announces rates
% Ratio
Sep 15
0.25
0.25
Sep 20, 2016
6:00PM
US
Housing Starts
Thousands
Aug
1,211.00
1,193.00
6:00PM
US
Building permits
Thousands
Aug
1,144.00
1,170.00
Sep 21, 2016
11:30PM
US
FOMC rate decision
%
Sep 21
0.50
0.50
Sep 22, 2016
7:30PM
Euro Zone
Euro-Zone Consumer Confidence
Value
Sep A
(8.50)
--
7:30PM
US
Existing home sales
Million
Aug
5.39
5.45
Sep 23, 2016
1:00PM
Germany
PMI Services
Value
Sep P
51.70
--
1:00PM
Germany
PMI Manufacturing
Value
Sep P
53.60
--
Sep 26, 2016
7:30PM
US
New home sales
Thousands
Aug
654.00
580.00
Sep 27, 2016
7:30PM
US
Consumer Confidence
S.A./ 1985=100
Sep
101.10
98.00
Sep 29, 2016
6:00PM
US
GDP Qoq (Annualised)
% Change
2Q T
1.10
1.30
1:25PM
Germany
Unemployment change (000's)
Thousands
Sep
(7.00)
--
Sep 30, 2016
2:00PM
UK
GDP (YoY)
% Change
2Q F
2.20
--
Oct 1, 2016
6:30AM
China
PMI Manufacturing
Value
Sep
50.40
--
Oct 3, 2016
2:00PM
UK
PMI Manufacturing
Value
Sep
53.30
--
Oct 4, 2016
11:00AM
India
RBI Reverse Repo rate
%
Oct 4
6.00
--
11:00AM
India
RBI Repo rate
%
Oct 4
6.50
--
11:00AM
India
RBI Cash Reserve ratio
%
Oct 4
4.00
--
Source: Bloomberg, Angel Research
Market Outlook
September 16, 2016
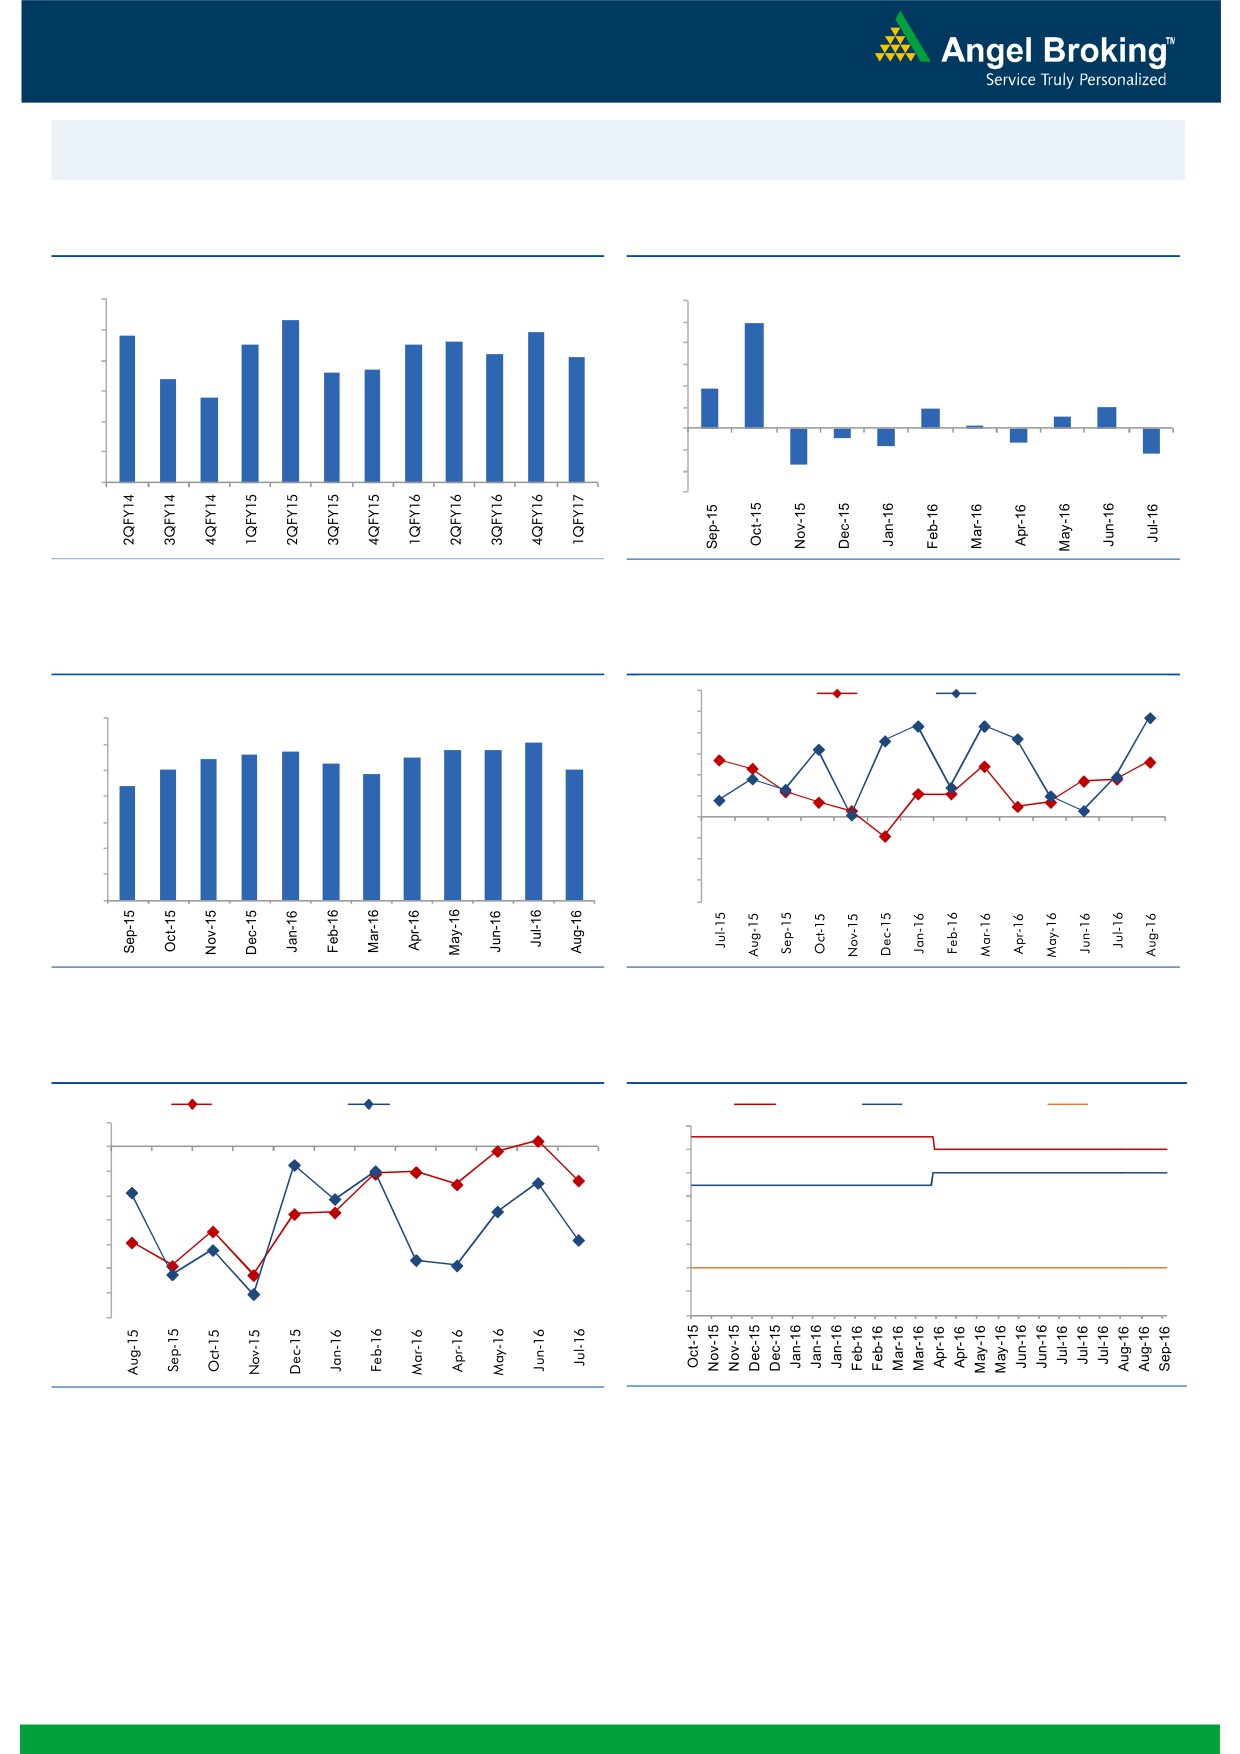
Macro watch
Exhibit 1: Quarterly GDP trends
Exhibit 2: IIP trends
(%)
(%)
9.0
12.0
8.3
9.9
7.8
7.9
8.0
7.5
7.5
7.6
10.0
7.2
7.1
8.0
6.6
6.7
7.0
6.4
6.0
3.7
5.8
6.0
4.0
1.9
2.0
1.1
2.0
0.3
5.0
-
4.0
(2.0)
(0.9)
(1.6)
(1.3)
(4.0)
(2.4)
3.0
(3.4)
(6.0)
Source: CSO, Angel Research
Source: MOSPI, Angel Research
Exhibit 3: Monthly CPI inflation trends
Exhibit 4: Manufacturing and services PMI
56.0
Mfg. PMI
Services PMI
(%)
55.0
7.0
6.1
5.6
5.7
5.8
5.8
54.0
6.0
5.4
5.5
5.0
5.3
5.1
53.0
4.8
5.0
4.4
52.0
4.0
51.0
50.0
3.0
49.0
2.0
48.0
1.0
47.0
-
46.0
Source: MOSPI, Angel Research
Source: Market, Angel Research; Note: Level above 50 indicates expansion
Exhibit 5: Exports and imports growth trends
Exhibit 6: Key policy rates
(%)
Exports yoy growth
Imports yoy growth
(%)
Repo rate
Reverse Repo rate
CRR
5.0
7.00
0.0
6.50
(5.0)
6.00
(10.0)
5.50
(15.0)
5.00
(20.0)
4.50
(25.0)
4.00
(30.0)
3.50
(35.0)
3.00
Source: Bloomberg, Angel Research
Source: RBI, Angel Research
Market Outlook
September 16, 2016
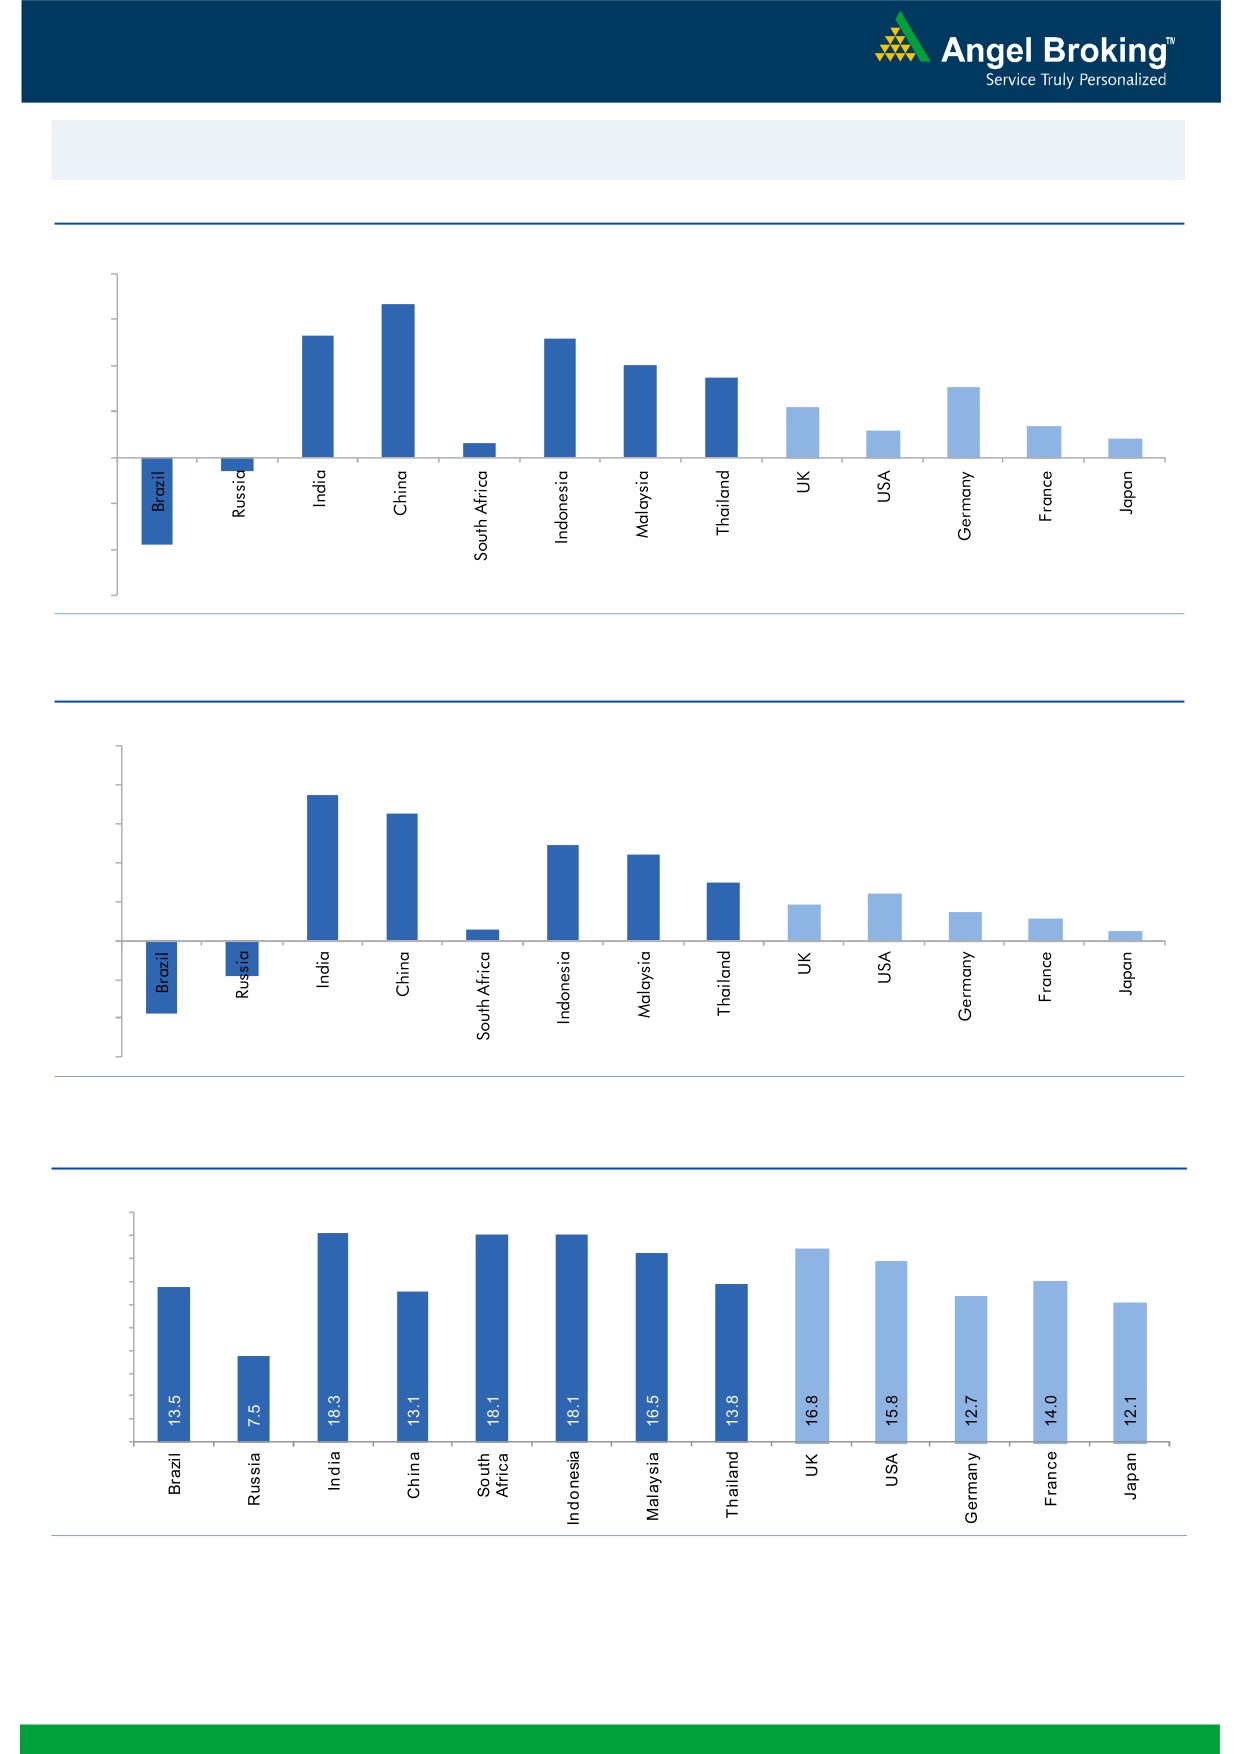
Global watch
Exhibit 1: Latest quarterly GDP Growth (%, yoy) across select developing and developed countries
(%)
8.0
6.7
6.0
5.3
0.6
5.2
4.0
3.5
4.0
3.1
2.2
1.4
2.0
1.2
0.8
-
(2.0)
(0.6)
(4.0)
(3.8)
(6.0)
Source: Bloomberg, Angel Research
Exhibit 2: 2016 GDP Growth projection by IMF (%, yoy) across select developing and developed countries
(%)
10.0
7.5
8.0
6.5
6.0
4.9
4.4
4.0
3.0
2.4
1.9
1.5
2.0
1.1
0.6
0.5
(3.8)
(1.8)
-
(2.0)
(4.0)
(6.0)
Source: IMF, Angel Research
Exhibit 3: One year forward P-E ratio across select developing and developed countries
(x)
20.0
18.0
16.0
14.0
12.0
10.0
8.0
6.0
4.0
2.0
-
Source: IMF, Angel Research
Market Outlook
September 16, 2016
Exhibit 4: Relative performance of indices across globe
Returns (%)
Country
Name of index
Closing price
1M
3M
1YR
Brazil
Bovespa
57,909
(2.1)
16.7
22.3
Russia
Micex
1,997
1.4
7.2
15.9
India
Nifty
8,743
1.8
6.8
11.6
China
Shanghai Composite
3,003
(3.9)
4.5
(5.3)
South Africa
Top 40
45,713
1.5
(1.0)
5.8
Mexico
Mexbol
45,923
(6.0)
1.2
4.5
Indonesia
LQ45
907
(3.8)
4.9
17.7
Malaysia
KLCI
1,653
(1.9)
0.7
4.4
Thailand
SET 50
932
(5.9)
2.4
3.0
USA
Dow Jones
18,212
(2.9)
2.0
7.7
UK
FTSE
6,730
(3.0)
13.1
10.3
Japan
Nikkei
16,405
(1.2)
3.0
(7.8)
Germany
DAX
10,431
(3.4)
8.7
4.7
France
CAC
4,373
(2.8)
5.2
(1.4)
Source: Bloomberg, Angel Research
Stock Watch
September 16, 2016
Company Name
Reco
CMP
Target
Mkt Cap
Sales ( Čcr )
OPM(%)
EPS (Č)
PER(x)
P/BV(x)
RoE(%)
EV/Sales(x)
(Č)
Price ( Č)
( Č cr )
FY17E FY18E
FY17E
FY18E
FY17E
FY18E
FY17E
FY18E
FY17E
FY18E
FY17E
FY18E
FY17E
FY18E
Agri / Agri Chemical
Rallis
Neutral
222
-
4,307
1,937
2,164
13.3
14.3
9.0
11.0
24.6
20.1
4.3
3.7
18.4
19.8
2.3
2.0
United Phosphorus
Neutral
684
-
34,683
15,176
17,604
18.5
18.5
37.4
44.6
18.3
15.3
3.6
3.0
21.4
21.2
2.4
2.0
Auto & Auto Ancillary
Ashok Leyland
Buy
82
111
23,208
22,407
26,022
10.6
10.6
5.2
6.4
15.6
12.7
3.5
3.0
23.6
24.7
1.1
0.9
Bajaj Auto
Neutral
2,932
-
84,841
25,093
27,891
19.5
19.2
143.9
162.5
20.4
18.0
5.7
4.9
30.3
29.4
3.1
2.7
Bharat Forge
Neutral
869
-
20,240
7,726
8,713
20.5
21.2
35.3
42.7
24.6
20.4
4.6
4.1
18.9
20.1
2.7
2.3
Eicher Motors
Neutral
22,440
-
60,950
16,583
20,447
17.5
18.0
598.0
745.2
37.5
30.1
12.8
9.8
41.2
38.3
3.5
2.8
Gabriel India
Neutral
116
-
1,661
1,544
1,715
9.0
9.3
5.4
6.3
21.4
18.4
4.0
3.6
18.9
19.5
1.0
0.9
Hero Motocorp
Neutral
3,523
-
70,342
31,253
35,198
15.3
15.0
172.3
192.1
20.5
18.3
7.5
6.4
38.9
37.0
2.1
1.9
Jamna Auto Industries Neutral
214
-
1,707
1,486
1,620
9.8
9.9
15.0
17.2
14.3
12.4
3.1
2.6
21.8
21.3
1.2
1.1
L G Balakrishnan & Bros Neutral
577
-
906
1,302
1,432
11.6
11.9
43.7
53.0
13.2
10.9
1.9
1.7
13.8
14.2
0.8
0.7
Mahindra and Mahindra Neutral
1,406
-
87,301
46,534
53,077
11.6
11.7
67.3
78.1
20.9
18.0
3.4
3.0
15.4
15.8
1.8
1.6
Maruti
Neutral
5,443
-
164,433
69,186
82,217
14.7
14.4
198.5
241.4
27.4
22.6
5.3
4.3
20.2
20.0
2.1
1.7
Minda Industries
Neutral
310
-
2,463
2,728
3,042
9.0
9.1
68.2
86.2
4.6
3.6
1.0
0.8
23.8
24.3
1.0
0.8
Motherson Sumi
Neutral
312
-
41,323
45,896
53,687
7.8
8.3
13.0
16.1
24.0
19.4
7.7
6.2
34.7
35.4
1.0
0.8
Rane Brake Lining
Neutral
1,296
-
1,025
511
562
11.3
11.5
28.1
30.9
46.1
41.9
7.0
6.4
15.3
15.0
2.1
2.0
Setco Automotive
Neutral
45
-
598
741
837
13.0
13.0
15.2
17.0
2.9
2.6
0.5
0.4
15.8
16.3
1.2
1.1
Tata Motors
Neutral
557
-
160,889
300,209
338,549
8.9
8.4
42.7
54.3
13.1
10.3
2.1
1.8
15.6
17.2
0.7
0.6
TVS Motor
Neutral
321
-
15,255
13,390
15,948
6.9
7.1
12.8
16.5
25.2
19.4
6.3
5.0
26.3
27.2
1.2
1.0
Amara Raja Batteries
Accumulate
1,039
1,174
17,753
5,429
6,471
17.5
17.6
35.3
43.5
29.4
23.9
6.8
5.5
25.3
24.8
3.1
2.5
Exide Industries
Neutral
195
-
16,545
7,439
8,307
15.0
15.0
8.1
9.3
24.0
20.9
3.4
3.0
14.3
16.7
1.8
1.6
Apollo Tyres
Neutral
215
-
10,962
12,877
14,504
14.3
13.9
21.4
23.0
10.1
9.4
1.6
1.4
16.4
15.2
1.0
0.9
Ceat
Accumulate
1,063
1,119
4,301
7,524
8,624
13.0
12.7
131.1
144.3
8.1
7.4
1.5
1.3
19.8
18.6
0.7
0.6
JK Tyres
Neutral
145
-
3,288
7,455
8,056
15.0
15.0
21.8
24.5
6.7
5.9
1.4
1.1
22.8
21.3
0.6
0.5
Swaraj Engines
Neutral
1,206
-
1,498
660
810
15.2
16.4
54.5
72.8
22.1
16.6
6.9
6.3
31.5
39.2
2.1
1.7
Subros
Neutral
135
-
810
1,488
1,681
11.7
11.9
6.4
7.2
21.1
18.9
2.2
2.0
10.8
11.4
0.8
0.7
Indag Rubber
Neutral
180
-
472
286
326
19.8
16.8
11.7
13.3
15.4
13.5
2.6
2.4
17.8
17.1
1.3
1.1
Capital Goods
ACE
Neutral
43
-
424
709
814
4.1
4.6
1.4
2.1
30.6
20.4
1.3
1.2
4.4
6.0
0.8
0.7
BEML
Buy
900
1,157
3,749
3,451
4,055
6.3
9.2
31.4
57.9
28.7
15.6
1.7
1.6
6.3
10.9
1.2
1.0
Bharat Electronics
Buy
1,219
1,414
29,262
8,137
9,169
16.8
17.2
58.7
62.5
20.8
19.5
3.2
2.9
44.6
46.3
2.6
2.3
Stock Watch
September 16, 2016
Company Name
Reco
CMP
Target
Mkt Cap
Sales ( Čcr )
OPM(%)
EPS (Č)
PER(x)
P/BV(x)
RoE(%)
EV/Sales(x)
(Č)
Price ( Č)
( Č cr )
FY17E
FY18E
FY17E
FY18E
FY17E
FY18E
FY17E
FY18E
FY17E
FY18E
FY17E
FY18E
FY17E
FY18E
Capital Goods
Voltas
Accumulate
384
407
12,699
6,511
7,514
7.9
8.7
12.9
16.3
29.8
23.6
5.4
4.7
16.7
18.5
1.7
1.4
BGR Energy
Neutral
117
-
842
16,567
33,848
6.0
5.6
7.8
5.9
15.0
19.8
0.9
0.8
4.7
4.2
0.2
0.1
BHEL
Neutral
150
-
36,787
28,797
34,742
-
2.8
2.3
6.9
65.4
21.8
1.1
1.1
1.3
4.8
0.9
0.7
Blue Star
Accumulate
514
578
4,901
4,351
5,024
6.4
7.1
17.2
20.6
29.9
24.9
19.5
16.2
23.1
24.1
1.2
1.0
Crompton Greaves
Neutral
80
-
5,017
5,777
6,120
5.9
7.0
3.3
4.5
24.3
17.8
1.1
1.0
4.4
5.9
0.8
0.7
Greaves Cotton
Neutral
135
-
3,303
1,755
1,881
16.8
16.9
7.8
8.5
17.3
15.9
3.5
3.2
20.6
20.9
1.6
1.4
Inox Wind
Buy
194
286
4,306
5,605
6,267
15.7
16.4
24.8
30.0
7.8
6.5
2.2
1.6
25.9
24.4
0.8
0.7
KEC International
Neutral
125
-
3,221
9,294
10,186
7.9
8.1
9.9
11.9
12.7
10.5
1.9
1.6
15.6
16.3
0.6
0.5
Thermax
Neutral
823
-
9,805
5,421
5,940
7.3
7.3
25.7
30.2
32.0
27.3
3.9
3.5
12.2
13.1
1.7
1.6
VATech Wabag
Buy
557
681
3,036
3,136
3,845
8.9
9.1
26.0
35.9
21.4
15.5
2.7
2.3
13.4
15.9
0.9
0.7
Cement
ACC
Neutral
1,606
-
30,158
11,225
13,172
13.2
16.9
44.5
75.5
36.1
21.3
3.4
3.2
11.2
14.2
2.7
2.3
Ambuja Cements
Neutral
261
-
51,845
9,350
10,979
18.2
22.5
5.8
9.5
45.0
27.5
3.8
3.4
10.2
12.5
5.5
4.7
India Cements
Neutral
148
-
4,534
4,364
4,997
18.5
19.2
7.9
11.3
18.7
13.1
1.3
1.3
8.0
8.5
1.8
1.6
JK Cement
Neutral
799
-
5,585
4,398
5,173
15.5
17.5
31.2
55.5
25.6
14.4
3.1
2.7
12.0
15.5
1.8
1.5
J K Lakshmi Cement
Neutral
472
-
5,555
2,913
3,412
14.5
19.5
7.5
22.5
63.0
21.0
3.9
3.3
12.5
18.0
2.5
2.1
Orient Cement
Neutral
208
-
4,252
2,114
2,558
18.5
20.5
8.1
11.3
25.6
18.4
3.8
3.2
9.0
14.0
2.6
2.1
UltraTech Cement
Neutral
3,929
-
107,838
25,768
30,385
21.0
23.5
111.0
160.0
35.4
24.6
4.5
4.0
13.5
15.8
4.3
3.6
Construction
ITNL
Neutral
92
-
3,026
8,946
10,017
31.0
31.6
8.1
9.1
11.4
10.1
0.4
0.4
4.2
5.0
3.7
3.4
KNR Constructions
Accumulate
707
802
1,989
1,385
1,673
14.7
14.0
41.2
48.5
17.2
14.6
3.2
2.8
14.9
15.2
1.5
1.3
Larsen & Toubro
Buy
1,471
1,700
137,061
67,665
77,249
10.7
11.5
57.3
71.2
25.7
20.7
2.4
2.2
12.6
14.3
2.2
1.9
Gujarat Pipavav Port
Neutral
182
-
8,779
705
788
52.2
51.7
5.0
5.6
36.3
32.4
3.6
3.2
11.2
11.2
12.1
10.3
Nagarjuna Const.
Neutral
86
-
4,789
8,842
9,775
9.1
8.8
5.3
6.4
16.3
13.5
1.3
1.2
8.2
9.1
0.7
0.6
PNC Infratech
Buy
122
143
3,131
2,350
2,904
13.1
13.2
9.0
8.8
13.6
13.9
0.5
0.4
15.9
13.9
1.5
1.2
Simplex Infra
Neutral
336
-
1,662
6,829
7,954
10.5
10.5
31.4
37.4
10.7
9.0
1.1
1.0
9.9
13.4
0.7
0.6
Power Mech Projects
Neutral
480
-
706
1,801
2,219
12.7
14.6
72.1
113.9
6.7
4.2
1.2
1.0
16.8
11.9
0.4
0.3
Sadbhav Engineering
Neutral
291
-
4,994
3,598
4,140
10.3
10.6
9.0
11.9
32.4
24.5
3.4
3.0
9.9
11.9
1.7
1.4
NBCC
Neutral
254
-
15,219
7,428
9,549
7.9
8.6
8.2
11.0
30.9
23.1
1.5
1.2
28.2
28.7
1.8
1.3
MEP Infra
Neutral
44
-
708
1,877
1,943
30.6
29.8
3.0
4.2
14.5
10.4
7.0
4.7
0.6
0.6
1.8
1.6
SIPL
Neutral
101
-
3,549
1,036
1,252
65.5
66.2
(8.4)
(5.6)
3.8
4.3
(22.8)
(15.9)
11.6
9.7
Stock Watch
September 16, 2016
Company Name
Reco
CMP
Target
Mkt Cap
Sales ( Čcr )
OPM(%)
EPS (Č)
PER(x)
P/BV(x)
RoE(%)
EV/Sales(x)
(Č)
Price ( Č)
( Č cr )
FY17E
FY18E
FY17E
FY18E
FY17E
FY18E
FY17E
FY18E
FY17E
FY18E
FY17E
FY18E
FY17E
FY18E
Construction
Engineers India
Neutral
257
-
8,674
1,725
1,935
16.0
19.1
11.4
13.9
22.6
18.5
3.1
3.0
13.4
15.3
4.0
3.5
Financials
Axis Bank
Neutral
589
-
140,520
58,081
66,459
3.5
3.5
32.4
44.6
18.2
13.2
2.4
2.1
13.6
16.5
-
-
Bank of Baroda
Neutral
167
-
38,387
19,980
23,178
1.8
1.8
11.5
17.3
14.5
9.6
1.7
1.4
8.3
10.1
-
-
Canara Bank
Neutral
305
-
16,545
15,225
16,836
1.8
1.8
14.5
28.0
21.0
10.9
1.5
1.2
5.8
8.5
-
-
Dewan Housing Finance Accumulate
285
325
8,312
2,225
2,688
2.9
2.9
29.7
34.6
9.6
8.2
1.6
1.3
16.1
16.8
-
-
Equitas Holdings
Buy
178
235
5,980
939
1,281
11.7
11.5
5.8
8.2
30.7
21.7
2.7
2.4
10.9
11.5
-
-
Federal Bank
Neutral
72
-
12,285
9,353
10,623
2.9
2.9
4.4
5.8
16.3
12.3
1.6
1.4
9.5
11.0
-
-
HDFC
Neutral
1,409
-
222,774
11,475
13,450
3.4
3.4
45.3
52.5
31.1
26.8
6.0
5.3
20.2
20.5
-
-
HDFC Bank
Accumulate
1,280
1,350
323,949
46,097
55,433
4.5
4.5
58.4
68.0
21.9
18.8
3.8
3.2
18.8
18.6
-
-
ICICI Bank
Neutral
271
-
157,435
39,029
45,903
3.3
3.3
16.7
16.3
16.2
16.6
2.0
1.8
10.1
12.4
-
-
LIC Housing Finance
Neutral
565
-
28,501
3,712
4,293
2.6
2.5
39.0
46.0
14.5
12.3
2.7
2.3
19.9
20.1
-
-
Punjab Natl.Bank
Neutral
139
-
27,235
23,532
23,595
2.3
2.4
6.8
12.6
20.4
11.0
3.2
2.2
3.3
6.5
-
-
RBL Bank
Accumulate
299
325
11,070
1,783
2,309
2.6
2.6
12.7
16.4
23.6
18.3
2.6
2.3
12.8
13.3
-
-
South Ind.Bank
Neutral
23
-
3,153
6,435
7,578
2.5
2.5
2.7
3.1
8.7
7.5
1.1
0.9
10.1
11.2
-
-
St Bk of India
Neutral
256
-
198,572
88,650
98,335
2.6
2.6
13.5
18.8
19.0
13.6
1.8
1.6
7.0
8.5
-
-
Union Bank
Neutral
144
-
9,865
13,450
14,925
2.3
2.3
25.5
34.5
5.6
4.2
0.8
0.7
7.5
10.2
-
-
Yes Bank
Neutral
1,222
-
51,438
8,978
11,281
3.3
3.4
74.0
90.0
16.5
13.6
3.1
2.7
17.0
17.2
-
-
FMCG
Asian Paints
Neutral
1,170
-
112,255
17,128
18,978
16.8
16.4
19.1
20.7
61.3
56.5
21.3
20.1
34.8
35.5
6.5
5.8
Britannia
Neutral
3,528
-
42,322
9,795
11,040
14.6
14.9
80.3
94.0
43.9
37.5
18.1
14.0
41.2
-
4.2
3.7
Colgate
Neutral
963
-
26,181
4,605
5,149
23.4
23.4
23.8
26.9
40.5
35.8
22.4
17.5
64.8
66.8
5.6
5.0
Dabur India
Neutral
293
-
51,516
8,315
9,405
19.8
20.7
8.1
9.2
36.2
31.8
10.1
8.3
31.6
31.0
5.8
5.1
GlaxoSmith Con*
Neutral
6,117
-
25,726
4,350
4,823
21.2
21.4
179.2
196.5
34.1
31.1
9.1
7.7
27.1
26.8
5.3
4.7
Godrej Consumer
Neutral
1,667
-
56,764
10,235
11,428
18.4
18.6
41.1
44.2
40.6
37.7
9.0
7.6
24.9
24.8
5.6
5.0
HUL
Neutral
914
-
197,855
35,252
38,495
17.6
17.4
20.4
21.9
44.8
41.8
36.8
32.3
82.2
77.3
5.4
5.0
ITC
Accumulate
255
283
307,926
40,059
44,439
39.0
39.2
9.1
10.1
28.1
25.3
7.6
6.7
27.2
26.5
7.2
6.4
Marico
Neutral
292
-
37,621
6,430
7,349
18.8
19.5
6.4
7.7
45.6
37.9
13.8
11.6
33.2
32.5
5.7
4.9
Nestle*
Neutral
6,296
-
60,705
10,073
11,807
20.7
21.5
124.8
154.2
50.5
40.8
20.7
18.6
34.8
36.7
5.8
5.0
Tata Global
Neutral
137
-
8,646
8,675
9,088
9.8
9.8
7.4
8.2
18.5
16.7
2.1
2.0
7.9
8.1
0.9
0.9
Procter & Gamble
Accumulate
6,705
7,369
21,765
2,939
3,342
23.2
23.0
146.2
163.7
45.9
41.0
102.7
98.5
25.3
23.5
6.9
6.0
Hygiene
Stock Watch
September 16, 2016
Company Name
Reco
CMP
Target
Mkt Cap
Sales ( Čcr )
OPM(%)
EPS (Č)
PER(x)
P/BV(x)
RoE(%)
EV/Sales(x)
(Č)
Price ( Č)
( Č cr )
FY17E FY18E
FY17E
FY18E
FY17E
FY18E
FY17E
FY18E
FY17E
FY18E
FY17E
FY18E
FY17E
FY18E
IT
HCL Tech^
Buy
778
1,000
109,736
49,242
57,168
20.5
20.5
55.7
64.1
14.0
12.1
2.8
2.2
20.3
17.9
2.1
1.7
Infosys
Buy
1,041
1,370
239,192
69,934
79,025
27.5
27.5
64.8
72.0
16.1
14.5
3.5
3.2
22.0
22.3
2.9
2.5
TCS
Buy
2,328
3,004
458,725
121,684
136,286
27.3
27.3
135.0
150.1
17.2
15.5
5.7
5.3
33.2
33.9
3.5
3.1
Tech Mahindra
Buy
463
700
44,977
30,347
33,685
17.0
17.0
37.5
41.3
12.4
11.2
2.7
2.3
21.8
20.7
1.2
1.0
Wipro
Buy
478
680
116,274
51,631
55,822
21.7
17.9
35.9
36.9
13.3
13.0
2.8
2.6
19.0
18.1
1.9
1.7
Media
D B Corp
Neutral
400
-
7,349
2,297
2,590
27.4
28.2
21.0
23.4
19.0
17.1
4.4
3.9
23.7
23.1
3.0
2.6
HT Media
Neutral
84
-
1,957
2,693
2,991
12.6
12.9
7.9
9.0
10.7
9.3
0.9
0.8
7.8
8.3
0.3
0.2
Jagran Prakashan
Buy
191
225
6,259
2,355
2,635
28.0
28.0
10.8
12.5
17.7
15.3
3.8
3.3
21.7
21.7
2.7
2.3
Sun TV Network
Neutral
507
-
19,998
2,850
3,265
70.1
71.0
26.2
30.4
19.4
16.7
5.0
4.4
24.3
25.6
6.6
5.6
Hindustan Media
Neutral
280
-
2,055
1,016
1,138
24.3
25.2
27.3
30.1
10.3
9.3
2.0
1.7
16.2
15.8
1.3
1.2
Ventures
TV Today Network
Buy
307
363
1,828
637
743
27.5
27.5
18.4
21.4
16.7
14.3
2.9
2.5
17.4
17.2
2.5
2.0
Metals & Mining
Coal India
Neutral
324
-
204,366
84,638
94,297
21.4
22.3
24.5
27.1
13.2
11.9
5.5
5.2
42.6
46.0
1.9
1.7
Hind. Zinc
Neutral
219
-
92,344
14,252
18,465
55.9
48.3
15.8
21.5
13.8
10.2
2.3
2.0
17.0
20.7
6.5
5.0
Hindalco
Neutral
145
-
29,984
107,899
112,095
7.4
8.2
9.2
13.0
15.8
11.2
0.8
0.7
4.8
6.6
0.8
0.7
JSW Steel
Neutral
1,754
-
42,402
53,201
58,779
16.1
16.2
130.6
153.7
13.4
11.4
1.8
1.6
14.0
14.4
1.6
1.4
NMDC
Neutral
103
-
40,737
6,643
7,284
44.4
47.7
7.1
7.7
14.5
13.3
1.3
1.2
8.8
9.2
3.9
3.5
SAIL
Neutral
48
-
19,721
47,528
53,738
(0.7)
2.1
(1.9)
2.6
18.4
0.5
0.5
(1.6)
3.9
1.3
1.2
Vedanta
Neutral
166
-
49,095
71,744
81,944
19.2
21.7
13.4
20.1
12.4
8.2
1.1
1.0
8.4
11.3
1.1
0.8
Tata Steel
Neutral
367
-
35,634
121,374
121,856
7.2
8.4
18.6
34.3
19.7
10.7
1.2
1.1
6.1
10.1
0.9
0.9
Oil & Gas
Cairn India
Neutral
192
-
36,054
9,127
10,632
4.3
20.6
8.8
11.7
21.9
16.4
0.7
0.7
3.3
4.2
5.4
4.5
GAIL
Neutral
385
-
48,855
56,220
65,198
9.3
10.1
27.1
33.3
14.2
11.6
1.3
1.2
9.3
10.7
1.1
0.9
ONGC
Neutral
248
-
212,048
137,222
152,563
15.0
21.8
19.5
24.1
12.7
10.3
1.1
1.0
8.5
10.1
1.8
1.6
Indian Oil Corp
Neutral
559
-
135,674
373,359
428,656
5.9
5.5
54.0
59.3
10.4
9.4
1.6
1.4
16.0
15.6
0.5
0.4
Reliance Industries
Neutral
1,062
-
344,494
301,963
358,039
12.1
12.6
87.7
101.7
12.1
10.5
1.2
1.1
10.7
11.3
1.6
1.3
Pharmaceuticals
Alembic Pharma
Neutral
629
-
11,854
3,483
4,083
20.2
21.4
24.3
30.4
25.9
20.7
5.9
4.7
25.5
25.3
3.3
2.8
Aurobindo Pharma
Accumulate
782
877
45,754
15,720
18,078
23.7
23.7
41.4
47.3
18.9
16.5
4.9
3.8
29.6
26.1
3.1
2.7
Sanofi India*
Neutral
4,317
-
9,942
2,357
2,692
17.3
17.3
153.5
169.2
28.1
25.5
4.8
3.9
25.8
28.4
3.9
3.2
Cadila Healthcare
Neutral
385
-
39,399
11,126
13,148
22.0
22.0
17.1
20.0
22.5
19.2
5.8
4.6
28.8
26.6
3.5
2.9
Cipla
Sell
584
490
46,965
15,378
18,089
17.4
18.4
21.6
27.2
27.1
21.5
3.5
3.1
13.7
15.2
3.3
2.7
Stock Watch
September 16, 2016
Company Name
Reco
CMP
Target
Mkt Cap
Sales ( Čcr )
OPM(%)
EPS (Č)
PER(x)
P/BV(x)
RoE(%)
EV/Sales(x)
(Č)
Price ( Č)
( Č cr )
FY17E FY18E
FY17E
FY18E
FY17E
FY18E
FY17E
FY18E
FY17E
FY18E
FY17E
FY18E
FY17E
FY18E
Pharmaceuticals
Dr Reddy's
Neutral
3,142
-
52,055
16,043
18,119
23.1
24.7
126.0
157.8
24.9
19.9
3.7
3.2
15.7
17.1
3.2
2.8
Dishman Pharma
Sell
180
45
2,902
1,718
1,890
22.7
22.8
9.5
11.3
18.9
15.9
1.8
1.7
10.1
10.9
2.2
1.9
GSK Pharma*
Neutral
2,977
-
25,217
3,528
3,811
16.6
18.8
51.8
59.4
57.5
50.1
15.4
15.3
26.3
30.6
6.9
6.5
Indoco Remedies
Sell
318
225
2,926
1,112
1,289
18.2
18.2
13.2
15.6
24.1
20.4
4.3
3.6
19.2
19.2
2.7
2.4
Ipca labs
Accumulate
576
613
7,271
3,303
3,799
15.3
15.3
17.3
19.7
33.3
29.3
2.9
2.7
9.1
9.4
2.3
2.0
Lupin
Buy
1,545
1,809
69,666
15,912
18,644
26.4
26.7
58.1
69.3
26.6
22.3
5.2
4.2
21.4
20.9
4.5
3.7
Sun Pharma
Buy
786
944
189,226
31,129
35,258
30.0
30.9
28.0
32.8
28.1
24.0
4.3
3.6
18.7
18.9
5.7
4.8
Power
Tata Power
Neutral
75
-
20,231
36,916
39,557
17.4
27.1
5.1
6.3
14.7
11.9
1.3
1.2
9.0
10.3
1.6
1.4
NTPC
Neutral
153
-
126,485
86,605
95,545
17.5
20.8
11.8
13.4
13.0
11.5
1.3
1.2
10.5
11.1
2.8
2.8
Power Grid
Neutral
175
-
91,527
25,763
29,762
74.3
73.1
14.8
17.3
11.8
10.1
1.9
1.6
16.9
17.5
7.8
7.4
Real Estate
MLIFE
Buy
430
522
1,764
1,152
1,300
22.7
24.6
29.9
35.8
14.4
12.0
1.1
1.0
7.6
8.6
2.2
1.9
Telecom
Bharti Airtel
Neutral
322
-
128,636
105,086
114,808
34.5
34.7
12.2
16.4
26.4
19.6
1.8
1.7
6.8
8.4
2.1
1.9
Idea Cellular
Neutral
84
-
30,355
40,133
43,731
37.2
37.1
6.4
6.5
13.2
13.0
1.1
1.0
8.2
7.6
1.8
1.5
zOthers
Abbott India
Neutral
4,560
-
9,690
3,153
3,583
14.1
14.4
152.2
182.7
30.0
25.0
147.1
125.6
25.6
26.1
2.8
2.4
Bajaj Electricals
Accumulate
269
306
2,717
5,099
5,805
5.6
5.9
11.4
14.6
23.6
18.4
3.2
2.8
13.4
15.1
0.5
0.5
Finolex Cables
Neutral
430
-
6,577
2,883
3,115
12.0
12.1
14.2
18.6
30.3
23.1
16.1
14.1
15.8
14.6
2.0
1.8
Goodyear India*
Accumulate
616
684
1,420
1,598
1,704
10.4
10.2
49.4
52.6
12.5
11.7
57.5
50.5
18.2
17.0
0.6
77.6
Hitachi
Neutral
1,503
-
4,087
2,081
2,433
8.8
8.9
33.4
39.9
45.0
37.7
36.3
30.3
22.1
21.4
2.0
1.6
Jyothy Laboratories
Neutral
321
-
5,818
1,440
2,052
11.5
13.0
8.5
10.0
37.8
32.1
9.2
8.5
18.6
19.3
4.3
3.0
Page Industries
Neutral
14,588
-
16,272
2,450
3,124
20.1
17.6
299.0
310.0
48.8
47.1
324.9
248.0
47.1
87.5
6.7
5.3
Relaxo Footwears
Neutral
430
-
5,156
2,085
2,469
9.2
8.2
7.6
8.0
56.8
54.1
22.0
18.8
17.9
18.8
2.6
2.2
Siyaram Silk Mills
Buy
1,277
1,469
1,197
1,799
2,040
11.6
11.7
104.9
122.4
12.2
10.4
2.0
1.7
16.4
16.4
0.9
0.8
Styrolution ABS India*
Neutral
584
-
1,027
1,440
1,537
9.2
9.0
40.6
42.6
14.4
13.7
36.7
33.4
12.3
11.6
0.7
0.6
TVS Srichakra
Accumulate
2,782
2,932
2,130
2,304
2,614
13.7
13.8
231.1
266.6
12.0
10.4
312.6
246.1
33.9
29.3
0.9
0.8
HSIL
Neutral
344
-
2,484
2,384
2,515
15.8
16.3
15.3
19.4
22.5
17.7
22.3
19.2
7.8
9.3
1.2
1.1
Kirloskar Engines India
Neutral
301
-
4,349
2,554
2,800
9.9
10.0
10.5
12.1
28.6
24.9
12.0
11.3
10.7
11.7
1.3
1.2
Ltd
M M Forgings
Neutral
422
-
509
546
608
20.4
20.7
41.3
48.7
10.2
8.7
57.8
51.2
16.6
17.0
0.8
0.7
Banco Products (India)
Neutral
233
-
1,668
1,353
1,471
12.3
12.4
14.5
16.3
16.1
14.3
22.2
20.0
14.5
14.6
1.2
126.2
Competent Automobiles Neutral
200
-
123
1,137
1,256
3.1
2.7
28.0
23.6
7.1
8.5
38.5
34.8
14.3
11.5
0.1
0.1
Stock Watch
September 16, 2016
Company Name
Reco
CMP
Target
Mkt Cap
Sales ( Čcr )
OPM(%)
EPS (Č)
PER(x)
P/BV(x)
RoE(%)
EV/Sales(x)
(Č)
Price ( Č)
( Č cr )
FY17E
FY18E
FY17E
FY18E
FY17E
FY18E
FY17E
FY18E
FY17E
FY18E
FY17E
FY18E
FY17E
FY18E
zOthers
Nilkamal
Neutral
1,338
-
1,997
1,995
2,165
10.7
10.4
69.8
80.6
19.2
16.6
76.5
66.4
16.6
16.5
1.0
0.9
Visaka Industries
Neutral
199
-
315
1,051
1,138
10.3
10.4
21.0
23.1
9.5
8.6
25.5
23.8
9.0
9.2
0.6
0.5
Transport Corporation of
Neutral
182
-
1,393
2,671
2,911
8.5
8.8
13.9
15.7
13.1
11.6
1.8
1.6
13.7
13.8
0.6
0.6
India
Elecon Engineering
Accumulate
59
63
644
1,482
1,660
13.7
14.5
3.9
5.8
15.2
10.2
3.6
3.3
7.8
10.9
0.8
0.7
Surya Roshni
Neutral
201
-
879
3,342
3,625
7.8
7.5
17.3
19.8
11.6
10.2
22.0
17.7
10.5
10.8
0.5
0.5
MT Educare
Neutral
127
-
506
366
417
17.7
18.2
9.4
10.8
13.6
11.8
3.0
2.6
22.2
22.3
1.3
1.1
Radico Khaitan
Buy
106
125
1,408
1,659
1,802
13.0
13.2
6.3
7.4
16.7
14.3
1.4
1.3
8.6
9.3
1.3
1.2
Garware Wall Ropes
Neutral
510
-
1,116
873
938
12.9
13.1
30.9
34.9
16.5
14.6
2.6
2.2
15.7
15.2
1.2
1.1
Wonderla Holidays
Neutral
399
-
2,255
287
355
38.0
40.0
11.3
14.2
35.3
28.1
5.1
4.4
21.4
23.9
7.5
6.1
Linc Pen & Plastics
Neutral
279
-
413
382
420
9.3
9.5
13.5
15.7
20.7
17.8
3.6
3.1
17.1
17.3
1.1
1.0
The Byke Hospitality
Neutral
158
-
635
287
384
20.5
20.5
7.6
10.7
20.9
14.8
4.4
3.5
20.7
23.5
2.2
1.7
Interglobe Aviation
Neutral
870
-
31,333
21,122
26,005
14.5
27.6
110.7
132.1
7.9
6.6
47.0
33.6
168.5
201.1
1.5
1.1
Coffee Day Enterprises
Neutral
238
-
4,912
2,964
3,260
20.5
21.2
4.7
8.0
-
29.8
2.8
2.5
5.5
8.5
2.1
1.8
Ltd
Navneet Education
Neutral
104
-
2,476
1,062
1,147
24.0
24.0
6.1
6.6
17.1
15.7
3.5
3.1
20.6
19.8
2.4
2.2
Navkar Corporation
Buy
200
265
2,848
408
612
42.9
42.3
6.8
11.5
29.5
17.4
2.0
1.8
6.9
10.5
7.9
5.3
UFO Moviez
Neutral
462
-
1,276
619
685
33.2
33.4
30.0
34.9
15.4
13.3
2.1
1.8
13.8
13.9
1.8
1.4
VRL Logistics
Neutral
290
-
2,649
1,902
2,119
16.7
16.6
14.6
16.8
19.9
17.3
4.4
3.8
21.9
22.2
1.5
1.3
Team Lease Serv.
Neutral
1,088
-
1,860
3,229
4,001
1.5
1.8
22.8
32.8
47.8
33.1
5.1
4.4
10.7
13.4
0.5
0.4
S H Kelkar & Co.
Neutral
308
-
4,457
1,036
1,160
15.1
15.0
6.1
7.2
50.5
42.9
5.4
4.9
10.7
11.5
4.2
3.7
Quick Heal
Neutral
225
-
1,576
408
495
27.3
27.0
7.7
8.8
29.1
25.6
2.7
2.7
9.3
10.6
3.0
2.5
Narayana Hrudaya
Neutral
320
-
6,540
1,873
2,166
11.5
11.7
2.6
4.0
121.0
80.7
7.4
6.7
6.1
8.3
3.6
3.1
Manpasand Bever.
Neutral
707
-
3,537
836
1,087
19.6
19.4
16.9
23.8
41.8
29.7
5.0
4.4
12.0
14.8
4.0
3.0
Parag Milk Foods
Neutral
330
-
2,773
1,919
2,231
9.3
9.6
9.5
12.9
34.9
25.5
5.4
4.5
15.5
17.5
1.6
1.4
Mirza International
Buy
92
113
1,109
1,024
1,148
18.0
18.0
6.9
8.0
13.4
11.5
2.3
1.9
16.6
16.2
1.3
1.1
Source: Company, Angel Research; Note: *December year end; #September year end; &October year end; Price as on September 15, 2016
Market Outlook
September 16, 2016
Research Team Tel: 022 - 39357800
DISCLAIMER
Angel Broking Private Limited (hereinafter referred to as “Angel”) is a registered Member of National Stock Exchange of India
Limited,Bombay Stock Exchange Limited and Metropolitan Stock Exchange Limited. It is also registered as a Depository Participant with
CDSL and Portfolio Manager with SEBI. It also has registration with AMFI as a Mutual Fund Distributor. Angel Broking Private Limited is a
registered entity with SEBI for Research Analyst in terms of SEBI (Research Analyst) Regulations, 2014 vide registration number
INH000000164. Angel or its associates has not been debarred/ suspended by SEBI or any other regulatory authority for accessing
/dealing in securities Market. Angel or its associates/analyst has not received any compensation / managed or
co-managed public offering of securities of the company covered by Analyst during the past twelve months.
This document is solely for the personal information of the recipient, and must not be singularly used as the basis of any investment
decision. Nothing in this document should be construed as investment or financial advice. Each recipient of this document should make
such investigations as they deem necessary to arrive at an independent evaluation of an investment in the securities of the companies
referred to in this document (including the merits and risks involved), and should consult their own advisors to determine the merits and
risks of such an investment.
Reports based on technical and derivative analysis center on studying charts of a stock's price movement, outstanding positions and
trading volume, as opposed to focusing on a company's fundamentals and, as such, may not match with a report on a company's
fundamentals. Investors are advised to refer the Fundamental and Technical Research Reports available on our website to evaluate the
contrary view, if any.
The information in this document has been printed on the basis of publicly available information, internal data and other reliable
sources believed to be true, but we do not represent that it is accurate or complete and it should not be relied on as such, as this
document is for general guidance only. Angel Broking Pvt. Limited or any of its affiliates/ group companies shall not be in any way
responsible for any loss or damage that may arise to any person from any inadvertent error in the information contained in this report.
Angel Broking Pvt. Limited has not independently verified all the information contained within this document. Accordingly, we cannot
testify, nor make any representation or warranty, express or implied, to the accuracy, contents or data contained within this document.
While Angel Broking Pvt. Limited endeavors to update on a reasonable basis the information discussed in this material, there may be
regulatory, compliance, or other reasons that prevent us from doing so.
This document is being supplied to you solely for your information, and its contents, information or data may not be reproduced,
redistributed or passed on, directly or indirectly.
Neither Angel Broking Pvt. Limited, nor its directors, employees or affiliates shall be liable for any loss or damage that may arise from
or in connection with the use of this information.